Getting Started with Diginsight
Diginsight streamlines logging and OpenTelemetry integration embracing .NET System.Diagnostics standard notation for activity tracing.
In the present article we’ll understand basic steps to enable application flow observability to local text based streams such as the application console or a log4net file, as well ass to the remote analysis tools such as Azure Monitor.
The code snippets below demonstrate how to use the .NET System.Diagnostics API to instrument a code span:
public async Task<Plant> GetPlantByIdAsync([FromRoute] Guid plantId)
{
    using var activity = Observability.ActivitySource.StartMethodActivity(logger, new { plantId });

    ...

    activity?.SetOutput(plant);
    return plant;
}
where, StartMethodActivity: - gathers automatically the method name, - renders automatically the method payload - writes the Span START and END to the logger variable
and SetOutput stores the method result for rendering within method END line.
This code generates a log stream like the following: 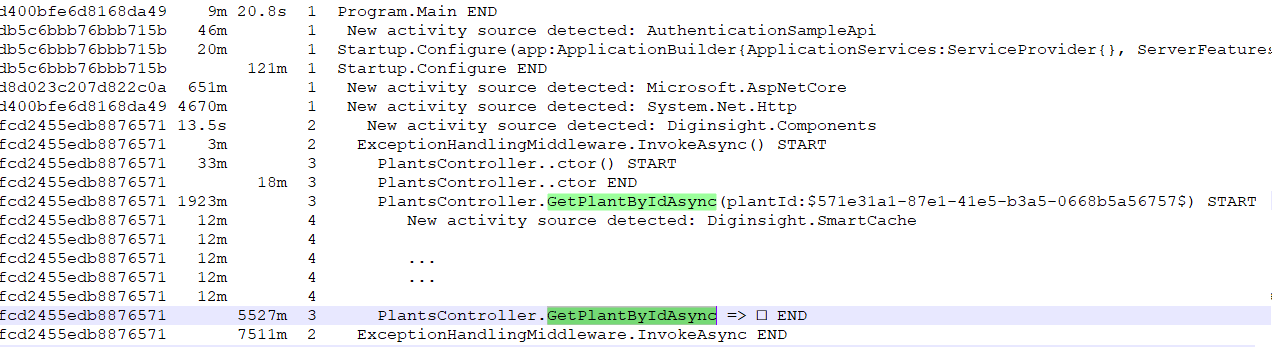
Standard rows within the section can be logged with ILogger<> methods.
...
var tenantId = options.TenantId;
var clientId = options.AppRegistrationClientId;
var clientSecret = options.AppRegistrationClientSecret;
logger.LogDebug("tenantId = {tenantId}, clientId = {clientId}, clientSecret = {clientSecret}", tenantId, clientId, clientSecret.Mask());
...
this generates a log raw as shown below 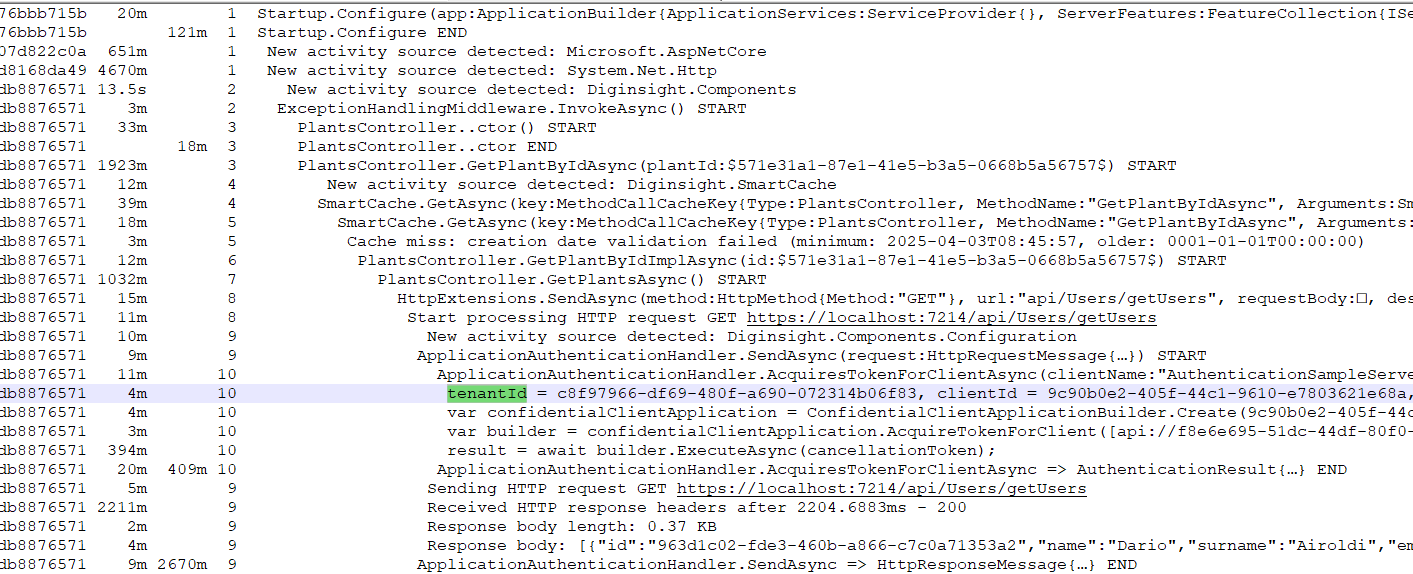
Steps to use Diginsight
You can obtain a console log or file log with diginsight by means of the following steps.
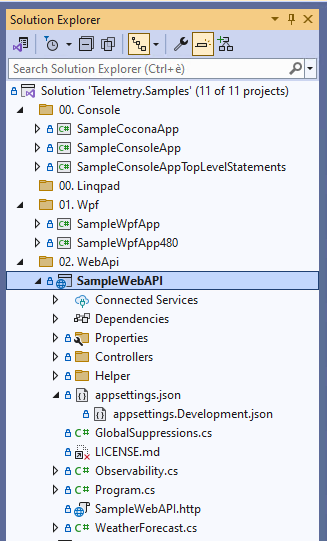
The code snippets below are available as working samples within the telemetry.samples repository.
Article HOWTO - Use Diginsight Samples: explores how we can use diginsight samples to test and understand integration of Diginsight telemetry in our own projects.
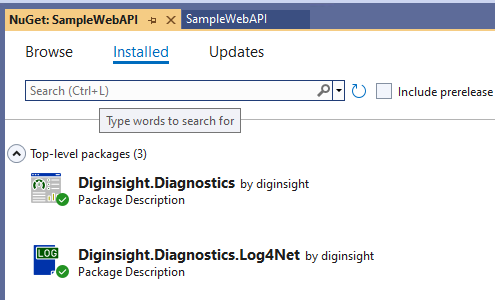
STEP 01 - Add a package reference to the package Diginsight.Diagnostics or Diginsight.Diagnostics.Log4Net
: {#step01 .sidebar=“STEP 01 - Add Package Reference”}
In the first step you can just add a diginsight reference to your code:
STEP 02 - Configure logging within the Startup sequence
: {#step01 .sidebar[STEP 02 - Configure logging]}
in the second step you can configure the startup sequence to enable diginsight log:
...
var builder = WebApplication.CreateBuilder(args);
var services = builder.Services;
var configuration = builder.Configuration;

services.ConfigureClassAware<DiginsightActivitiesOptions(configuration.GetSection("Diginsight:Activities"));
services.Configure<DiginsightConsoleFormatterOptions(configuration.GetSection("Diginsight:Console"));
services.AddLogging(
    loggingBuilder =>
    {
        loggingBuilder.ClearProviders();
        if (configuration.GetValue("Observability:ConsoleEnabled", true))
        {
            loggingBuilder.AddDiginsightConsole();
        }
        if (configuration.GetValue("Observability:Log4NetEnabled", true))
        {
            //loggingBuilder.AddDiginsightLog4Net("log4net.config");
            loggingBuilder.AddDiginsightLog4Net(static sp =>
            {
                IHostEnvironment env = sp.GetRequiredService<IHostEnvironment>();
                string fileBaseDir = env.IsDevelopment()
                        ? Environment.GetFolderPath(Environment.SpecialFolder.UserProfile, Environment.SpecialFolderOption.DoNotVerify)
                        : $"{Path.DirectorySeparatorChar}home";
                return new IAppender[]
                {
                    new RollingFileAppender()
                    {
                        ...
                    },
                };
            },
            static _ => log4net.Core.Level.All);
        }
    }
);
services.TryAddSingleton<IActivityLoggingSampler,NameBasedActivityLoggingSampler>();

services.AddControllers();
services.AddEndpointsApiExplorer();
services.AddSwaggerGen();
...
in this case: - AddDiginsightConsole() is used to enabled log to the application Console. - AddDiginsightLog4Net() is used to enabled file log by means of log4net.
also, - the Diginsight:Activities section can be used to specify enabled ActivitySources and whether Activity logging is enabled.
- the Diginsight:Console section can be used to specify console options.
- NameBasedActivityLoggingSampler filters log based on Diginsight:Activities section.
STEP 03 - Add telemetry to code with StartMethodActivity() and ILogger Statements
: {#step01 .sidebar[STEP 03 - Add telemetry]}
we are now ready to add instrumentation to the code and make the application flow observable:
public async Task<Plant> GetPlantByIdAsync([FromRoute] Guid plantId)
{
    using var activity = Observability.ActivitySource.StartMethodActivity(logger, () => new { plantId });

    ...

    activity?.SetOutput(plant);
    return plant;
}
Please, note that in this case the method payload is passed to StartMethodActivity by means of a delegate notation so that the payload class allocation can be avoided when logging or payload rendering is disabled.
STEP 04 - Enable OpenTelemetry and send data to the remote tools
With few changes to the startup sequence, telemetry can be sent to the remote tools.
Telemetry to the local tools is less expensive, more efficient, well protected and, often, it is not even persisted.
So, telemetry to the local tools can include verbose data with the maximum level of information.
Telemetry to the remote tools is more expensive (in cost and performance) so it will normally include only critical and warning non verbose information.
In our samples we enable openteemetry by means of the AddObservability() extension method that essentially: - Configures Opentelemetry options - Registers Opentelemetry logging provider - Configures tracing to the remote tools - Configures metrics to the remote tools
the startup sequence will resemble as shown below:
...
var builder = WebApplication.CreateBuilder(args);
var services = builder.Services;
var configuration = builder.Configuration;
var environment = builder.Environment;

// Adds logging and opentelemetry
services.AddObservability(configuration, environment, out IOpenTelemetryOptions openTelemetryOptions);

observabilityManager.AttachTo(services);
services.TryAddSingleton<IActivityLoggingSampler, NameBasedActivityLoggingSampler>();

services.AddControllers();
// Learn more about configuring Swagger/OpenAPI at https://aka.ms/aspnetcore/swashbuckle
services.AddEndpointsApiExplorer();
services.AddSwaggerGen();

builder.Host.UseDiginsightServiceProvider(true);
app = builder.Build();

// Configure the HTTP request pipeline.
if (app.Environment.IsDevelopment())
{
    app.UseSwagger();
    app.UseSwaggerUI();
}

app.UseHttpsRedirection();
app.UseAuthorization();
app.MapControllers();
...
As a reference example you can use the SampleWebAPI into the telemetry.samples repository.
Details about opentelemetry configuration is available here: HowTo: Configure diginsight telemetry to the remote tools.
Build and Test
Clone the repository, open and build solution Common.Diagnostics.sln. run EasySample and open the log file in your *** folder.
Contribute
Contribute to the repository with your pull requests.
License
See the LICENSE file for license rights and limitations (MIT).